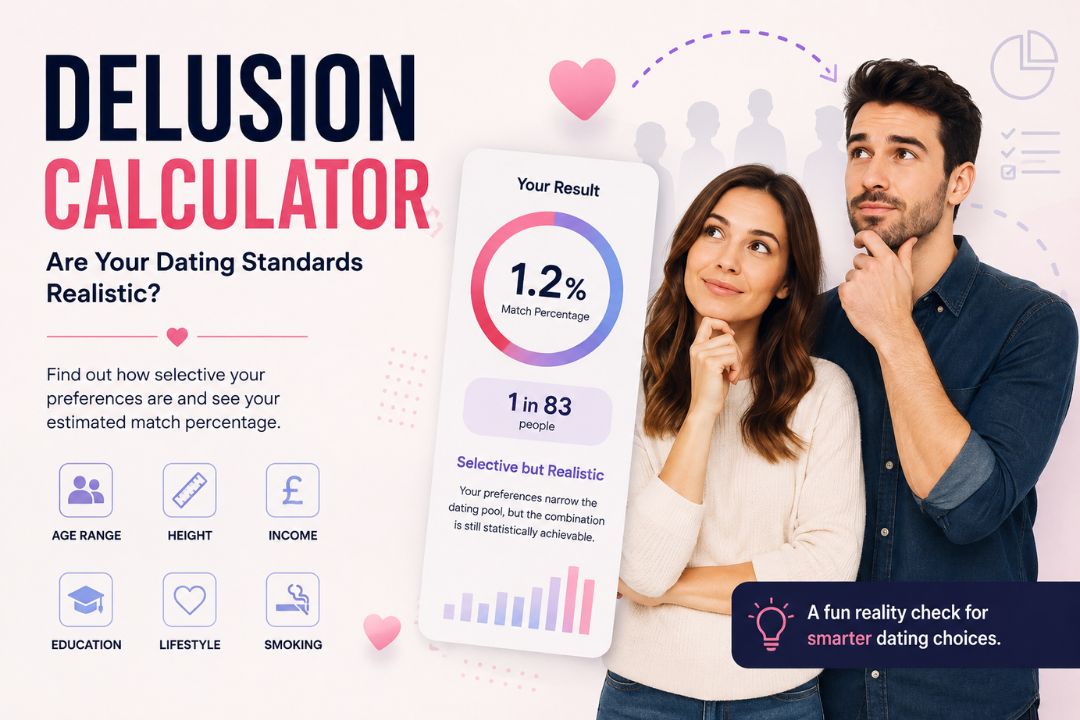
Delusion Calculator
Discover how realistic your ideal partner preferences are. Enter your criteria below for an estimated reality check.
Delusion Calculator: Are Your Dating Standards Realistic?
Dating preferences are personal. Everyone has an idea of the type of person they would like to meet, whether those preferences involve age, height, income, education, lifestyle, fitness, relationship history, or other characteristics. However, when many preferences are combined, the number of people who meet every requirement can become much smaller than expected. A Delusion Calculator is designed to illustrate this idea by estimating how selective a particular set of dating preferences may be.
The Delusion Calculator on CalQenix is a simple interactive tool that allows users to enter different partner preferences and receive an estimated match percentage. The purpose is not to judge anyone’s standards or tell users whom they should date. Instead, the calculator provides a light-hearted statistical perspective on how different requirements can narrow a potential dating pool.
The tool can be particularly interesting for people who want to understand the difference between having a few preferences and creating a very specific list of requirements. A single preference may leave a large number of possible matches available, while several strict preferences applied at the same time may dramatically reduce the estimated percentage.
What Is a Delusion Calculator?
A Delusion Calculator is an online dating standards calculator that estimates how common or uncommon your preferred combination of characteristics might be within a general population.
For example, someone may prefer a partner within a certain age range, above a particular height, earning at least a specified annual income, holding a university degree, being single, having no children, being physically fit, and not smoking.
Each requirement on its own may be relatively common. However, the important question is how many people are likely to satisfy all of those preferences at the same time.
That is the basic idea behind the calculator.
The calculator takes the preferences entered by the user, applies estimated probability values to each selected criterion, and combines them to produce an overall estimated match percentage. It may also display the result as approximate odds, such as one person in a certain number of people.
The result should be viewed as an educational estimate rather than a prediction of whether someone will find a partner.
How Does the Delusion Calculator Work?
Using the CalQenix Delusion Calculator is straightforward. You enter your preferred criteria into the available fields and then select the calculate button.
The calculator considers several factors that can influence the estimated size of your potential dating pool.
One of the first factors is age. Instead of requiring one exact age, the calculator allows users to choose a minimum and maximum age. A wider age range generally includes more people, while a narrow range makes the preference more selective.
Height is another factor. Users can specify a minimum and maximum preferred height. Because height is distributed differently across populations, restricting the acceptable height range can reduce the estimated number of potential matches.
Income preferences can also have a major impact. Choosing no minimum income requirement keeps the income filter broad. Selecting increasingly high income thresholds generally makes the criteria more selective because fewer people fall into higher earning categories.
The calculator can also include education level. Someone who has no education preference will naturally have a larger potential pool than someone who requires every potential partner to have a postgraduate qualification.
Other filters may include marital status, children, fitness level, and smoking status.
When the calculation is performed, the tool combines these factors and estimates what percentage of people could potentially meet all the selected conditions.
Why Do Multiple Dating Preferences Reduce the Match Percentage?
One of the most interesting parts of a Delusion Calculator is seeing how quickly percentages can decrease when multiple filters are applied.
Imagine that 60% of a population satisfies one preference and 50% satisfies another. Assuming the characteristics were independent for a simplified example, the percentage satisfying both would be approximately 30%.
Add another preference satisfied by 40% of people and the combined percentage could fall further.
This effect continues as more restrictions are added.
This is why a person may select requirements that individually appear completely reasonable yet receive a relatively low overall match percentage.
The calculator is essentially demonstrating the statistical effect of intersection.
You are not asking how many people meet preference A or preference B. You are asking how many people meet preference A and preference B and preference C and every other requirement simultaneously.
The more specific the combination becomes, the rarer the theoretical match may become.
Understanding Your Estimated Match Percentage
After completing the calculator, you may receive a percentage representing the estimated proportion of people who meet the selected preferences.
A higher percentage generally indicates broader or more flexible criteria. A lower percentage indicates a more selective combination.
For example, a result of 15% would mean that the simplified model estimates around 15 out of every 100 people in the relevant population may satisfy the selected criteria.
A result of 1% would theoretically represent around one person out of every 100.
A result of 0.1% would correspond to around one person out of every 1,000.
These figures can make the result easier to understand because very small percentages are sometimes difficult to visualise.
However, the result should not be interpreted as the exact probability of meeting your ideal partner.
Real dating populations are influenced by far more variables than an online calculator can measure.
What Does “1 in X” Mean?
The CalQenix Delusion Calculator may show approximate odds alongside the percentage result.
For example, if the estimated percentage is 2%, the calculator could express this as approximately 1 in 50.
This does not mean that every fiftieth person you meet will definitely match your preferences.
It simply converts the estimated percentage into a format that may be easier to understand.
Real-world dating opportunities depend on location, social networks, age distribution, gender distribution, relationship status, culture, dating apps, lifestyle, personal attraction, and many additional factors.
Therefore, the “1 in X” figure is best viewed as a simplified mathematical illustration.
Age Preferences and Dating Standards
Age is one of the most common considerations in dating.
Some people prefer partners close to their own age, while others are comfortable with a broader range. Statistically, a wider age preference increases the size of the theoretical dating pool.
For example, selecting ages 25 to 40 includes substantially more possible candidates than selecting only ages 29 to 31.
Neither preference is automatically right or wrong. The calculator simply demonstrates the numerical effect of narrowing the acceptable range.
Users may find it interesting to calculate their result once with their original age preference and then again with a slightly wider range to see how much difference it makes.
Height Preferences
Height can significantly affect the result when very strict limits are selected.
Suppose someone wants a partner above a particular height that only a relatively small percentage of the population reaches. That preference alone may substantially reduce the estimated dating pool.
Adding additional requirements such as high income or a particular education level can make the final combination much rarer.
The calculator uses a simplified statistical height distribution to estimate this factor. Actual height distributions vary between countries, genders, age groups, and populations, so the result should always be treated as approximate.
Income Preferences
Income is often one of the strongest filters in dating standards calculators.
Most populations have many more people earning average incomes than exceptionally high incomes. As a result, increasing the required minimum salary can quickly decrease the estimated percentage.
For example, requiring a partner to earn a comfortable salary may leave a reasonable portion of the population available. Requiring an income among the highest earners can reduce the pool much more significantly.
Income can also vary substantially depending on age, profession, location, working hours, and economic conditions.
Someone earning £50,000 in one region may have a very different lifestyle from someone earning the same amount in another.
The calculator therefore uses income as a simple numerical filter rather than an assessment of financial compatibility.
Education Preferences
Education is another optional factor that can influence the result.
Users may choose to have no educational preference or specify that a potential partner should have college, university, or postgraduate qualifications.
Higher education requirements usually reduce the estimated pool because progressively smaller proportions of a population hold advanced qualifications.
However, education level does not automatically indicate intelligence, success, compatibility, personality, or relationship quality.
The calculator simply treats education as one measurable preference selected by the user.
Marital Status and Children
Relationship history is important to many people.
Some users may prefer someone who has never been married, while others may be comfortable dating someone who is divorced or widowed.
Similarly, some people are open to partners who already have children, while others prefer partners without children.
These preferences can affect the estimated match percentage because they divide the population into smaller groups.
Again, the calculator is not determining which preference is better. It is showing what happens mathematically when a specific condition is added to several other conditions.
Fitness and Lifestyle Preferences
Fitness can mean different things to different people.
For one person, it may mean exercising occasionally and maintaining a generally active lifestyle. For another, it could mean regular gym training, competitive sport, or maintaining a highly athletic physique.
The calculator simplifies these differences into broad fitness categories.
Choosing increasingly specific fitness preferences can lower the estimated result.
Lifestyle filters such as smoking can have a similar effect. Selecting only non-smokers excludes smokers from the potential pool, while choosing no preference keeps both groups available.
These filters can be particularly relevant because lifestyle compatibility often plays an important role in long-term relationships.
Does a Low Percentage Mean Your Standards Are Too High?
Not necessarily.
A low percentage simply means that your selected combination of measurable preferences is statistically restrictive within the calculator’s simplified model.
It does not automatically mean that your standards are unreasonable.
Some criteria may be extremely important to you. For example, smoking status, desire for children, religious compatibility, lifestyle, or relationship goals may be genuine deal-breakers.
The useful question is not simply whether your percentage is high or low.
A better question is which preferences are essential and which are optional.
The calculator can help users explore that distinction.
If removing one minor preference increases the potential dating pool considerably, you may decide that the preference was less important than you originally thought.
Alternatively, you may decide that you are perfectly comfortable maintaining strict standards even if they reduce the number of potential matches.
Both conclusions are valid.
Can the Delusion Calculator Predict Dating Success?
No.
A Delusion Calculator cannot predict whether you will meet someone, fall in love, have a successful relationship, or get married.
It only works with a limited set of measurable characteristics.
Successful relationships depend on factors that cannot easily be reduced to numbers, including communication, emotional maturity, kindness, trust, humour, shared experiences, physical chemistry, values, conflict management, goals, and mutual commitment.
Two people can meet every demographic preference and still be completely incompatible.
Likewise, someone who does not match every item on an ideal checklist may turn out to be an excellent partner.
The calculator should therefore be used as a curiosity, entertainment tool, or starting point for reflection rather than a relationship prediction system.
Why Your Real Dating Pool May Be Different
Your actual dating pool can differ greatly from the calculator result.
Geography is one major reason.
Someone living in London has access to a different population than someone living in a small rural town.
Age demographics also differ between locations.
Career preferences may matter more in some cities, while cultural or religious factors may strongly influence dating opportunities in other communities.
Dating apps can expand the number of people you encounter, while personal social circles may narrow it.
Attraction also works in both directions. Finding someone who meets your preferences does not automatically mean that person will be interested in you.
For a relationship to develop, preferences and attraction generally need to be mutual.
This is one of the major limitations of any dating probability calculator.
How to Use the Calculator as a Reality Check
One of the best ways to use the Delusion Calculator is to experiment with different scenarios.
Start by entering your genuine ideal preferences.
Calculate the result and note the estimated percentage.
Then adjust one preference.
For example, widen the age range slightly and calculate again.
Next, lower the income requirement or select no income preference.
Try removing a height restriction.
Compare the results after each change.
This approach helps show which criteria are having the largest mathematical impact on the potential dating pool.
You may discover that one specific requirement reduces the percentage dramatically while several other preferences have only a minor effect.
That information can make the calculator more useful than simply looking at one final percentage.
Is the Delusion Calculator Accurate?
The calculator provides an estimate, not an exact population count.
Demographic characteristics are complex and often correlated with one another.
For example, income can be related to age and education. Marital status can also vary significantly with age. Fitness, smoking habits, earnings, and education may differ between demographic groups.
A simple calculator cannot perfectly model every interaction between those variables.
Reliable population data can also change over time.
For this reason, CalQenix presents the result as an estimated reality check rather than a scientifically exact dating probability.
The tool is designed to demonstrate how combining preferences affects probability, not to provide a definitive census of potential partners.
Final Thoughts
The Delusion Calculator offers a fun way to explore the mathematics behind dating preferences.
Most people naturally have standards, preferences, and deal-breakers. The calculator simply demonstrates that every additional requirement can reduce the number of people who match the complete list.
A low result does not tell you to abandon your standards, and a high result does not guarantee that finding a compatible partner will be easy.
Instead, the calculator can encourage a more thoughtful question: which qualities actually matter most?
Height, income, education, age, and lifestyle can all influence attraction and compatibility, but they represent only a small part of what makes relationships work.
Emotional connection, shared values, communication, respect, reliability, attraction, and long-term goals may ultimately matter far more than a statistical profile.
Use the CalQenix Delusion Calculator to experiment with your preferences, compare different scenarios, and see how selective your ideal combination may be. Treat the percentage as an informative estimate rather than a verdict on your dating life.
Most importantly, remember that people are more complicated than statistics. A calculator can estimate how rare a combination of characteristics might be, but it cannot measure chemistry, connection, personality, or the unexpected qualities that often make someone the right match.
